The Business Canvases module is aimed to support the “Discovery” part of the Planning effort.
A Business Canvas can be used to capture ideas, or other information, early on in a business innovation or transformation initiative. This is typically done during brainstorm sessions or workshops. A famous example is the so-called Business Model Canvas. This type of Business Canvas, and also variations of it, such as the Lean Canvas, captures ideas about a new or transformed Business Model. Information that is captured in such Business Canvases can be mapped to model data in the more structured representation of Business Models, as is used in Strategyplanner for prototyping strategy and impact analysis of business innovations or transformations. Other types of Business Canvases may further support discovery or analysis early on in an initiative, even when the information that is captured in it cannot be mapped to structured Business Models directly. An example of this latter sort of Business Canvases is the SWOT Analysis Canvas.
Business Model Canvas by Alexander Osterwalder from www.businessmodelgeneration.com
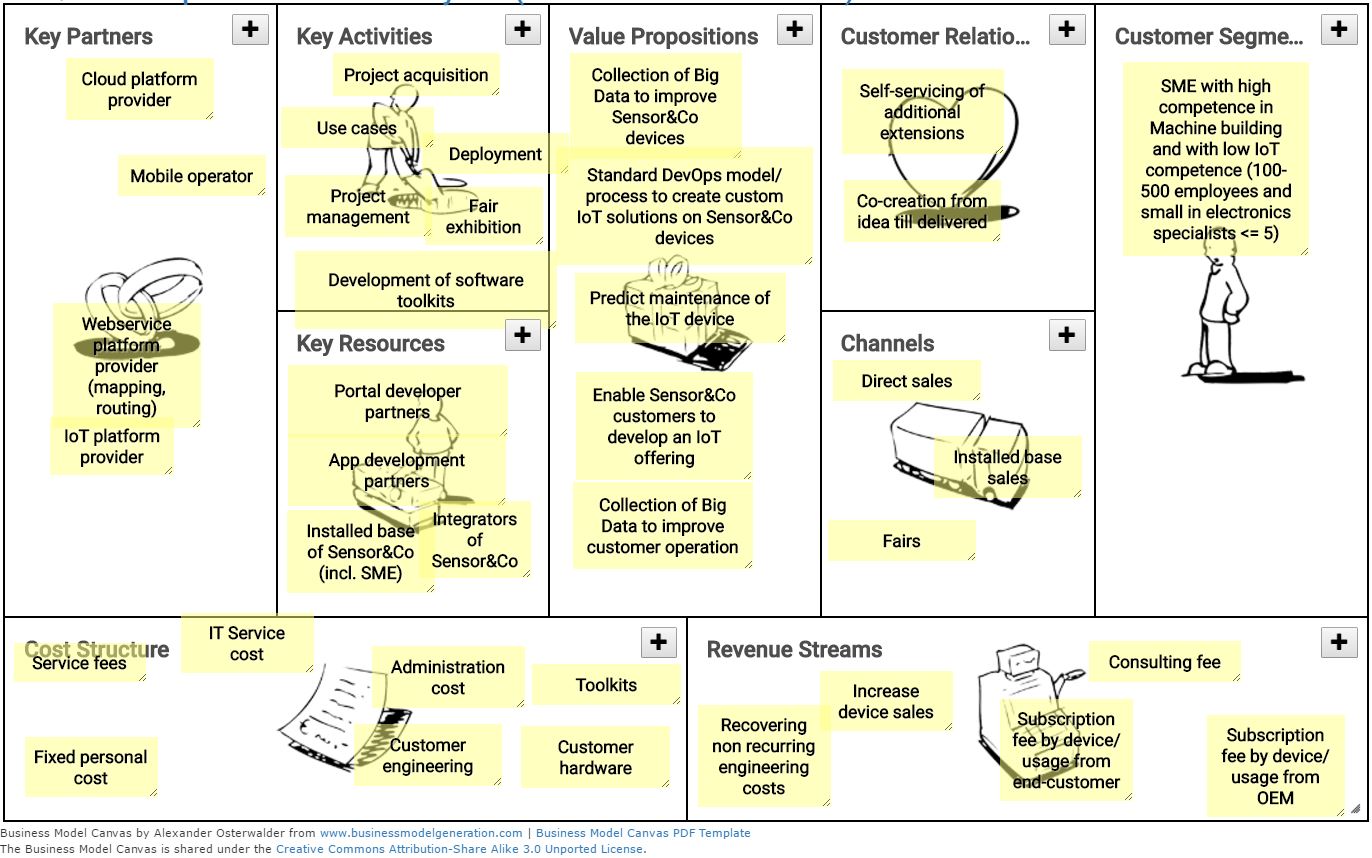
The Business Model Canvas of Alexander Osterwalder is typically used in an early stage to discover the ideas for an innovation or transformation program. The expression of your strategy in a one pager is very powerful. VDMbee added Business Simulation to this concept by allowing you to map the individual slips into your business model plan.
Slips in the Business Model Canvas can, dependent on their dimension, be mapped to elements in structured Business Models, as well as to Plan Values, in Strategyplanner. Based on such mapping, elements in structured Business Models (and Plans) can be created and existing ones can be selected for visualization.
Multi Business Model Innovation by Peter Lindgren
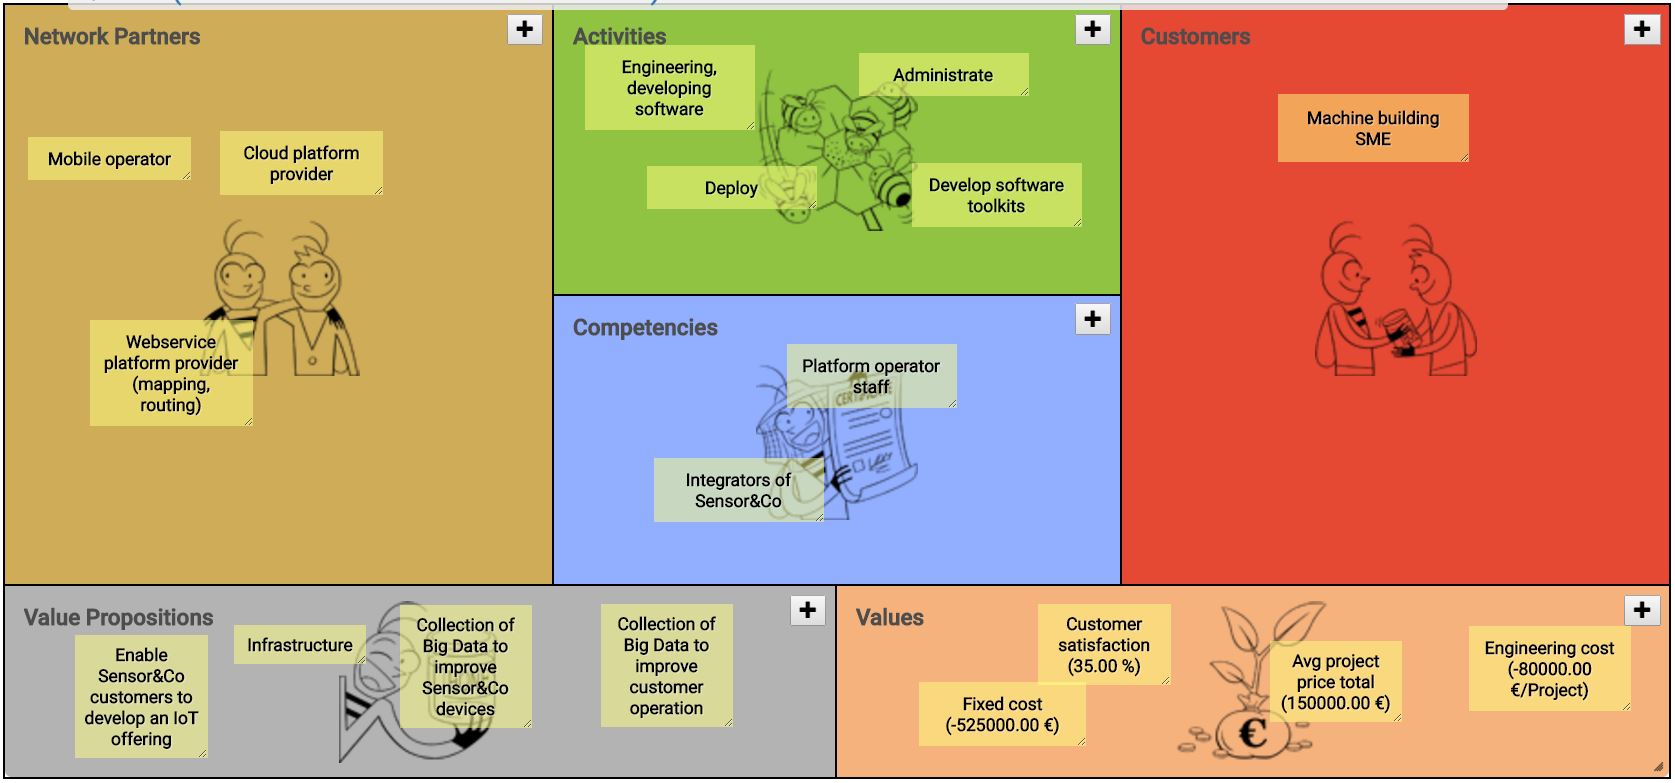
The Business Model Innovation Canvas of Peter Lindgren is typically used in an early stage to discover the ideas for a Multi Business Model innovation or transformation program. The expression of your Business Network Innovation strategy in simple to read canvases is very powerful. Also the Value definition of prof. Peter Lindgren is very compelling, definitely a forward looking view. Values in our today world are much more than just cost and revenue defined values. VDMbee added Business Simulation to this concept by allowing you to map the individual slips into your Business Model Plan.
A Business Model Innovation Canvas is defined in six dimensions:
Customer(s) or Market Segment(s) that is (are) served
Value Propositions that are provided and received
Activities to create and deliver Value Propositions
Competencies used to perform Activities
Partners involved
Values delivered by Value Propositions and created by Activities
The rationale of how Value is created and delivered is defined by how the various elements according to these six dimensions are interrelated. These relations can be created within the Business Model of Strategyplanner .
Slips in the Business Model Innovation Canvas can, dependent on their dimension, be mapped to elements in structured Business Models, as well as to Plan Values, in Strategyplanner . Based on such mapping, elements in structured Business Models (and Plans) can be created and existing ones can be selected for visualization. Note that, for Business Model Innovation Canvas, such mapping is straightforward, as essentially the Business Model Innovation Canvas is a two-dimensional representation of the Business Model Cube in Strategyplanner .
Lean Startup Canvas
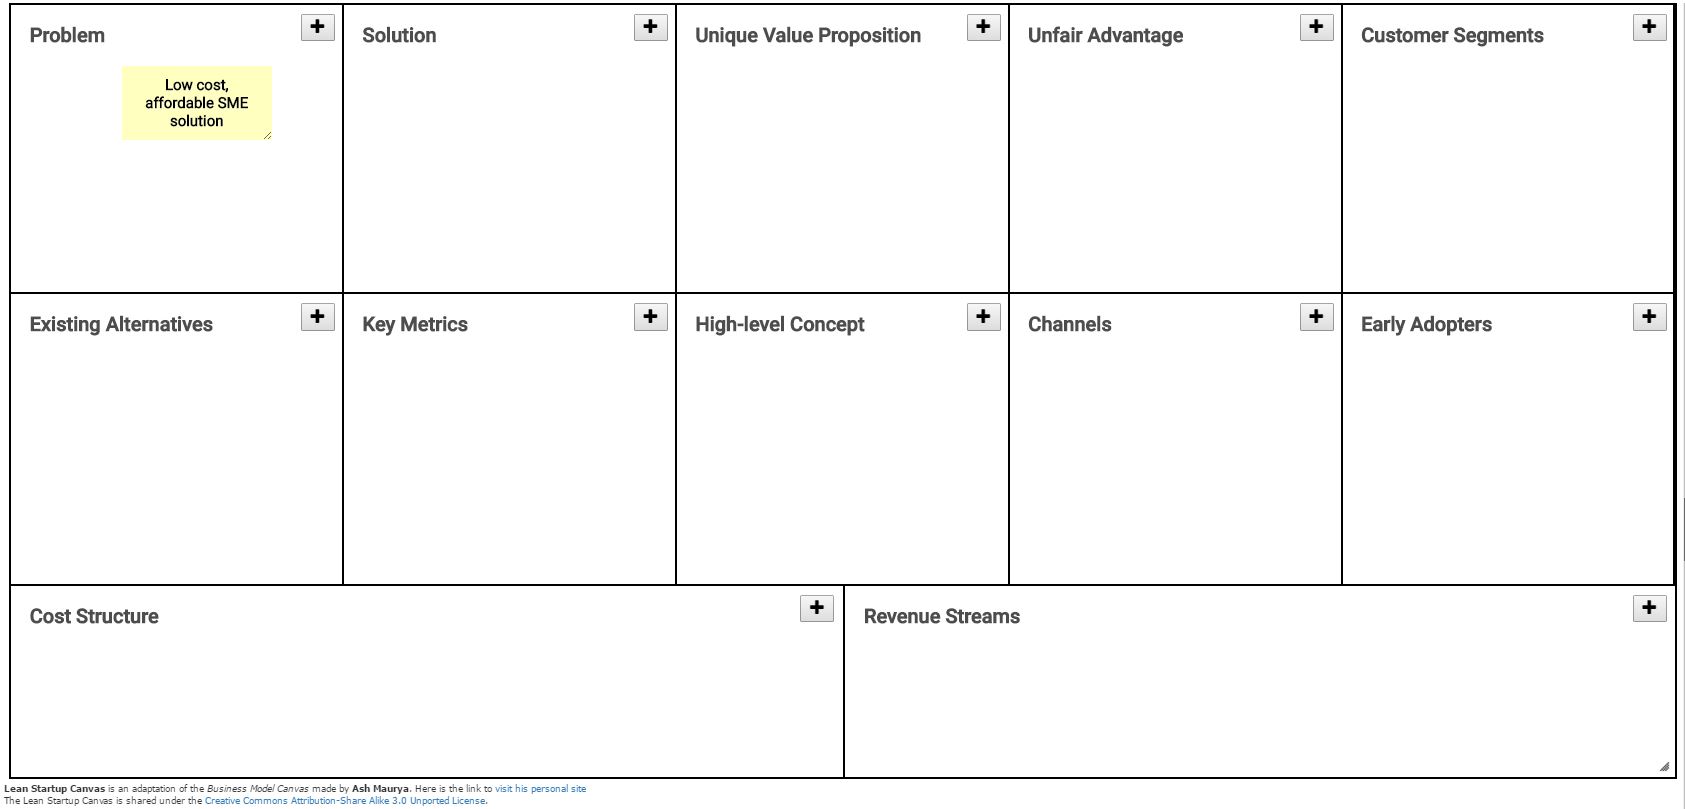
The Lean Startup Canvas is invented by Ash Maurya with the main objective to make the Lean Startup Canvas as actionable as possible while staying entrepreneur-focused (see: why-lean-canvas). The metaphor in mind was that of a grounds-up tactical plan or blueprint that guided the entrepreneur as they navigated their way from ideation to building a successful startup. The Lean Startup principles had a big influence on the design.
“Startups operate under conditions of extreme uncertainty.” – Eric Ries
The approach of making the canvas actionable was capturing that which was most uncertain, or more accurately, that which was most risky.
“Uncertainty – The lack of complete certainty, that is, the existence of more than one possibility.”
“Risk – A state of uncertainty where some of the possibilities involve a loss, catastrophe, or other undesirable outcome.” – Douglas Hubbard
Lean Canvas was designed for entrepreneurs, not consultants, customers, advisers, or investors. That said, the entrepreneur can greatly benefit by engaging all of those people while validating their canvas. For more see: “The Different Worldviews of Startups”.
VDMbee added Business Simulation to this concept by allowing you to map the individual slips into your business model plan.
Slips in the Lean Startup Canvas can, dependent on their dimension, be mapped to elements in structured Business Models, as well as to Plan Values, in Strategyplanner. Based on such mapping, elements in structured Business Models (and Plans) can be created and existing ones can be selected for visualization.
Lean Change Canvas
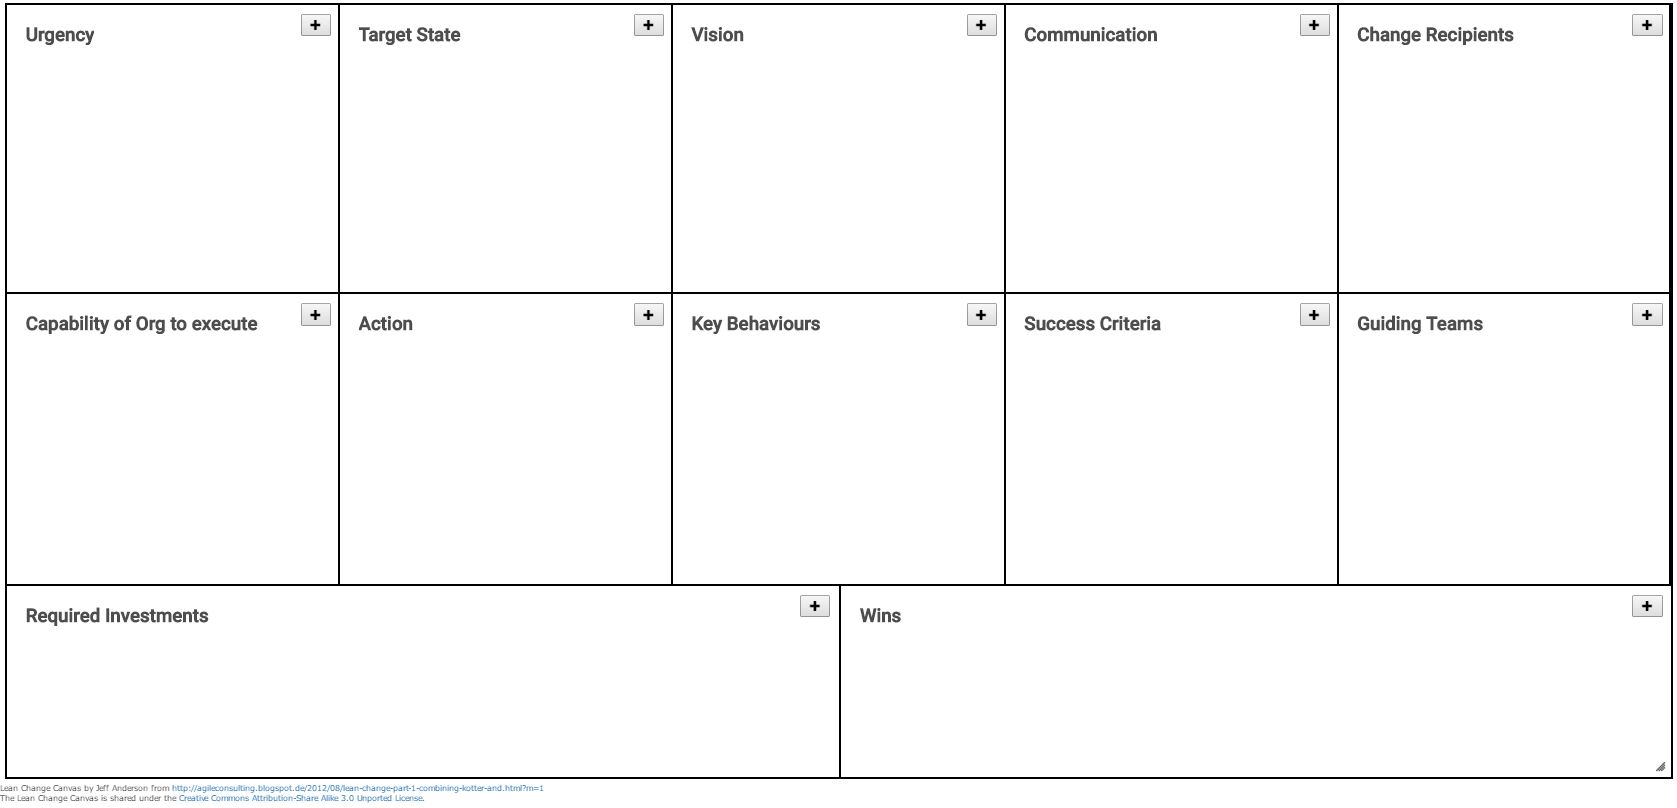
Unlike the seminal Business Model Canvas itself, the Lean Change Canvas is not particularly focusing on the description of the Business Model to introduce or to transition to, but rather puts various relevant aspects of a change together in a concise template. It provides a template that is useful to motivate, plan and manage a change, e.g., a transition from an As-Is to a To-Be Business Model. The To-Be state is only described roughly and at high level.
Change agents collaborate to develop an overarching Change Canvas. For some dimensions, slips in the Lean Change Canvas can be mapped to Plan Values in Strategyplanner. Based on such mapping, Plan Values can be created and existing ones can be selected for visualisation.
SWOT analyses Canvas

SWOT analysis (alternatively SWOT matrix) is an acronym for strengths, weaknesses, opportunities, and threats and is a structured planning method that evaluates those four elements of a project or business venture. A SWOT analysis can be carried out for a company, product, place, industry, or person. It involves specifying the objective of the business venture or project and identifying the internal and external factors that are favorable and unfavorable to achieve that objective.
The degree to which the internal environment of the firm matches with the external environment is expressed by the concept of strategic fit:
Strengths: characteristics of the business or project that give it an advantage over others
Weaknesses: characteristics that place the business or project at a disadvantage relative to others
Opportunities: elements in the environment that the business or project could exploit to its advantage
Threats: elements in the environment that could cause trouble for the business or project
Identification of SWOTs is important because they can inform later steps in planning to achieve the objective. First, decision-makers should consider whether the objective is attainable, given the SWOTs. If the objective is not attainable, they must select a different objective and repeat the process.
Personal Business Model Canvas
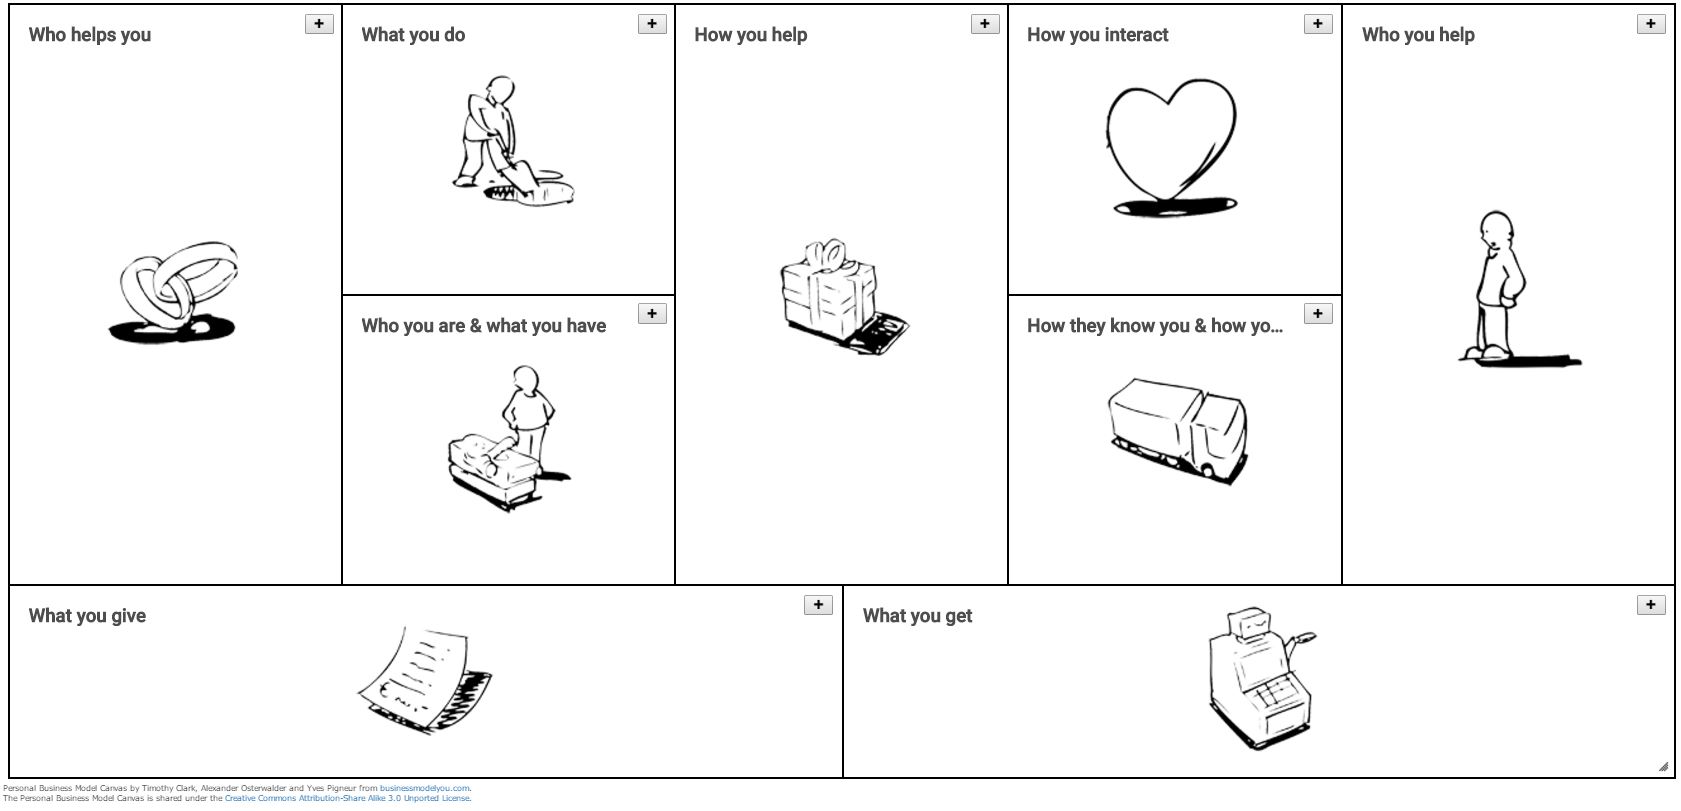
Personal Business Model Canvas is invented by Business Model You, LLC, is located in Portland, Oregon in the United States, and was formed expressly to develop, extend, and implement the Business Model You® career design and talent management methodology. For further details, please visit http://businessmodelyou.com/
Slips in the Personal Business Model Canvas can, dependent on their dimension, be mapped to elements in structured Business Models, as well as to Plan Values, in Strategyplanner. Based on such mapping, elements in structured Business Models (and Plans) can be created and existing ones can be selected for visualization.
Integrated Reporting Canvas by M. Adams
M. Adams view about: Value Management – The next stage in integrated thinking
The stated goal of integrated reporting is to explain “how a company creates value over time.”
To date, a lot of the focus in practice (and theory) has been on identifying the key capitals that drive this value creation. But the question about how value and the capitals change over time, and how the capitals interact with each other has been too advanced for most practitioners. I’ve been lucky to witness the development of a platform that endeavors to help business people map and model value creation in a dynamic way. It’s called VDMBee Strategyplanner.
VDMbee approached me about including the open Value Creation Worksheet tool that I’ve been using for a number of years into their platform. It’s there now along with a number of other tools such as Alex Osterwalder’s Business Model Canvas. I can’t wait to dig in and test it out and hope to find a good test case (contact me if you’re interested).
A little bit of background: The connection between my intangible capital work and VDMbee goes back to shared ideas and work with Verna Allee. I can actually remember the airplane trip when I opened Verna’s 2002 book The Future of Knowledge. In it, Verna laid out powerful ideas about flows of value in networks. Her work and that of many others led to the formation of the Value Delivery Modelling Language™ (VDML™) managed by Object Management Group® (OMG®), an international, open membership, not-for-profit technology standards consortium. As explained in the standard: VDML is designed to address several critical business challenges:
- It creates a robust way to model both tangible and intangible value flows;
- It provides the capacity to model complex collaborations and business networks;
- It provides a flexible way to model business activities to more readily support continuous transformation in environments of high variability; and
- It supports more effective shared capabilities optimization and deployment.
Table below highlights these challenges and VDML solutions The VDMbee Strategyplanner is the first software implementation using VDML. It’s a forward-looking tool to model how value gets created. But once in use, I can see how it will inform measurement of success against a plan.
Here’s how the integrated reporting community could use the platform:
- Identify the core capitals of the company (using the Value Creation Worksheet)
- Model how the capitals combine to create value over time
- Measure the value flows
- Create different cases to test how changes in one part of the system might affect others
- Compare projected versus actual performance
I’ve used earlier versions of the Value Network approach. It is an extremely robust way of modelling
value. I think that we will all learn a lot from using tools like this.
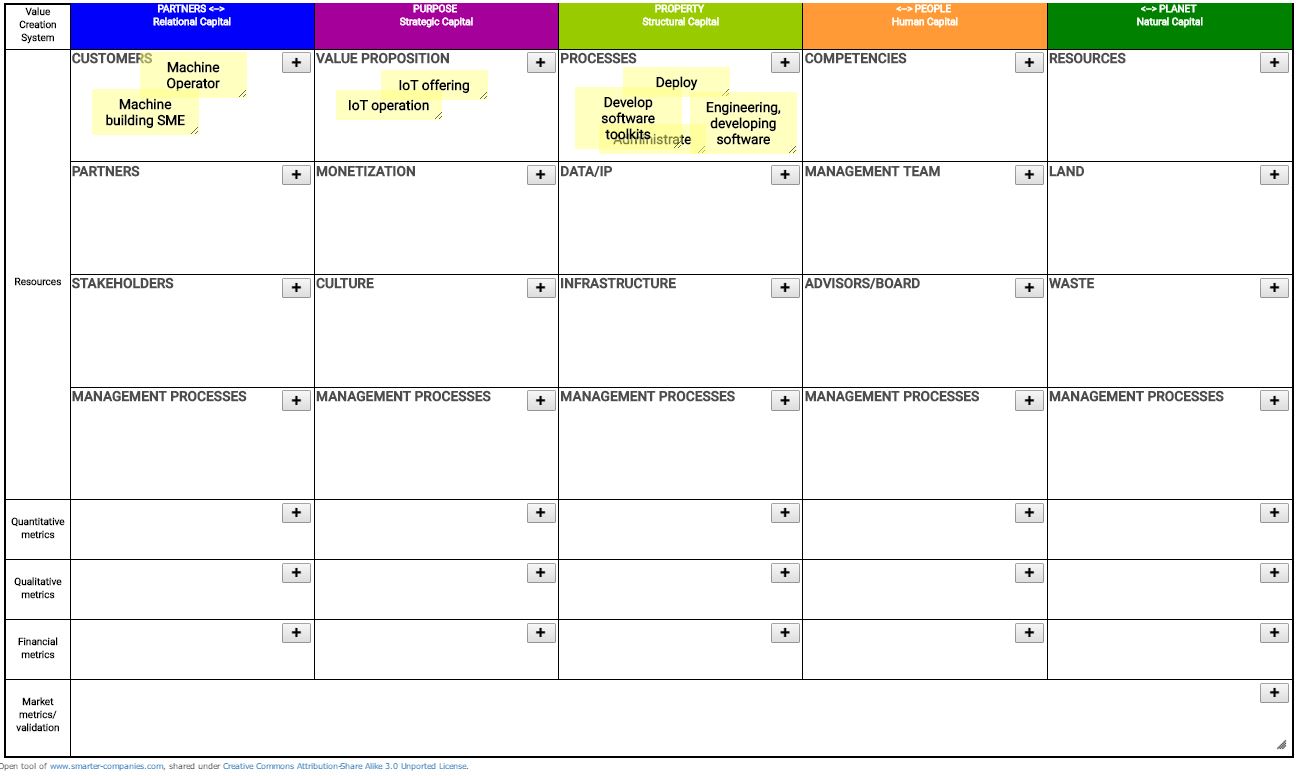
This value creation worksheet is a way of generating an inventory and metrics of the unique value creation resources that an organization owns or attracts. It is a way of developing and modelling integrated reports, as well as of assessing business innovations and transformations. This canvas is designed by Mary Adams of Smarter Companies and co-author of Intangible Capital.
To begin, it can be helpful to ask: What is the problem that your organization solves? After you answer this, fill in the first row to start then move on to the next rows and/or columns. The goal is to identify up to five separate elements in each Resource box (five is an arbitrary number but it gives you an idea that this exercise is looking for the most important resources that affect value creation). The five categories of Resources, or “Capitals” are:
Partners (or: Relational Capital). Relational capital connects your organization with its stakeholders. This is a form of attracted capital (↔) because it is not owned by the company, though it is necessary to its value creation system.
Purpose (or: Strategic Capital). Strategic capital gives your organization purpose. It is what you do to create value for your customers. This is a form of owned capital but feels very intangible. This section endeavors to make strategic capital more tangible and measurable.
Property (or: Structural Capital). Structural capital includes all knowledge that stays behind when your employees go home at the end of the day or leave the company. This is a form of owned capital although much of its value is not captured in traditional financial reporting.
People (or: Human Capital). Human capital is the creative engine of every organization. It is the intangible capital that goes home at night, and also leaves the company with people who resign or retire. Human capital includes the competencies and experience of the employees and the management. This is a form of attracted capital (↔).
Planet (or: Natural Capital). Every organization is part of our natural ecosystem. This includes basics such as air, water and energy. And it may include any number of other natural resources. Although some natural resources can be owned, their use is usually subject to controls and an overall license to operate. For this reason, natural capital can be considered a form of attracted capital (↔).
After you have identified the resources, you can use this Business Canvas to organize the key metrics that help track the performance and health of the capitals. Metrics are a powerful way of communicating about your capitals. The ideal is to use metrics that are already part of your management system. If you add new metrics make sure that they are material to your value creation. Ask yourself, will we take action if this metric changes? (If not, it may not be a material metric.) The following types of metrics are distinguished:
Quantitative metrics, often called Key Performance Indicators (KPI’s), are elements that lend themselves to counting. Simple examples are number of employees or customers, transaction throughput and use of natural resources.
Qualitative metrics add a level of judgment. These may be internally generated, such as prospect ratings in a sales system. Or they may be externally generated such as a Glassdoor rating.
Financial metrics use accounting information such as revenues and cost or investment. In general, relational capital drives revenues. Strategic capital is the formula for profits. Much of the money spent on the other value creation capitals is treated as a cost. If you are making investments in long-term capabilities, it can be worthwhile to detail these intangible capital expenditures separately.
Market Metrics / Validation. The market makes determinations about the strength and outlook of the combined value creation system in two related ways. The first is your reputation. One proxy for this is a net promoter score. The second is corporate valuation. This amount is determined by the public markets and/or expert valuation firms. A formal valuation process makes assumptions about the value creation system to create discounted cash flow analyses. So controlling the conversation about value creation can help control the valuation conversation.
The various Capitals are subdivided into specific matrix elements, that are defined below, whereby the definition of metrics is not further specified for the various types of metrics.
Slips in the Integrated Reporting Canvas can, dependent on their dimension, be mapped to elements in structured Business Models, as well as to Plan Values, in Strategyplanner. Based on such mapping, elements in structured Business Models (and Plans) can be created and existing ones can be selected for visualization.
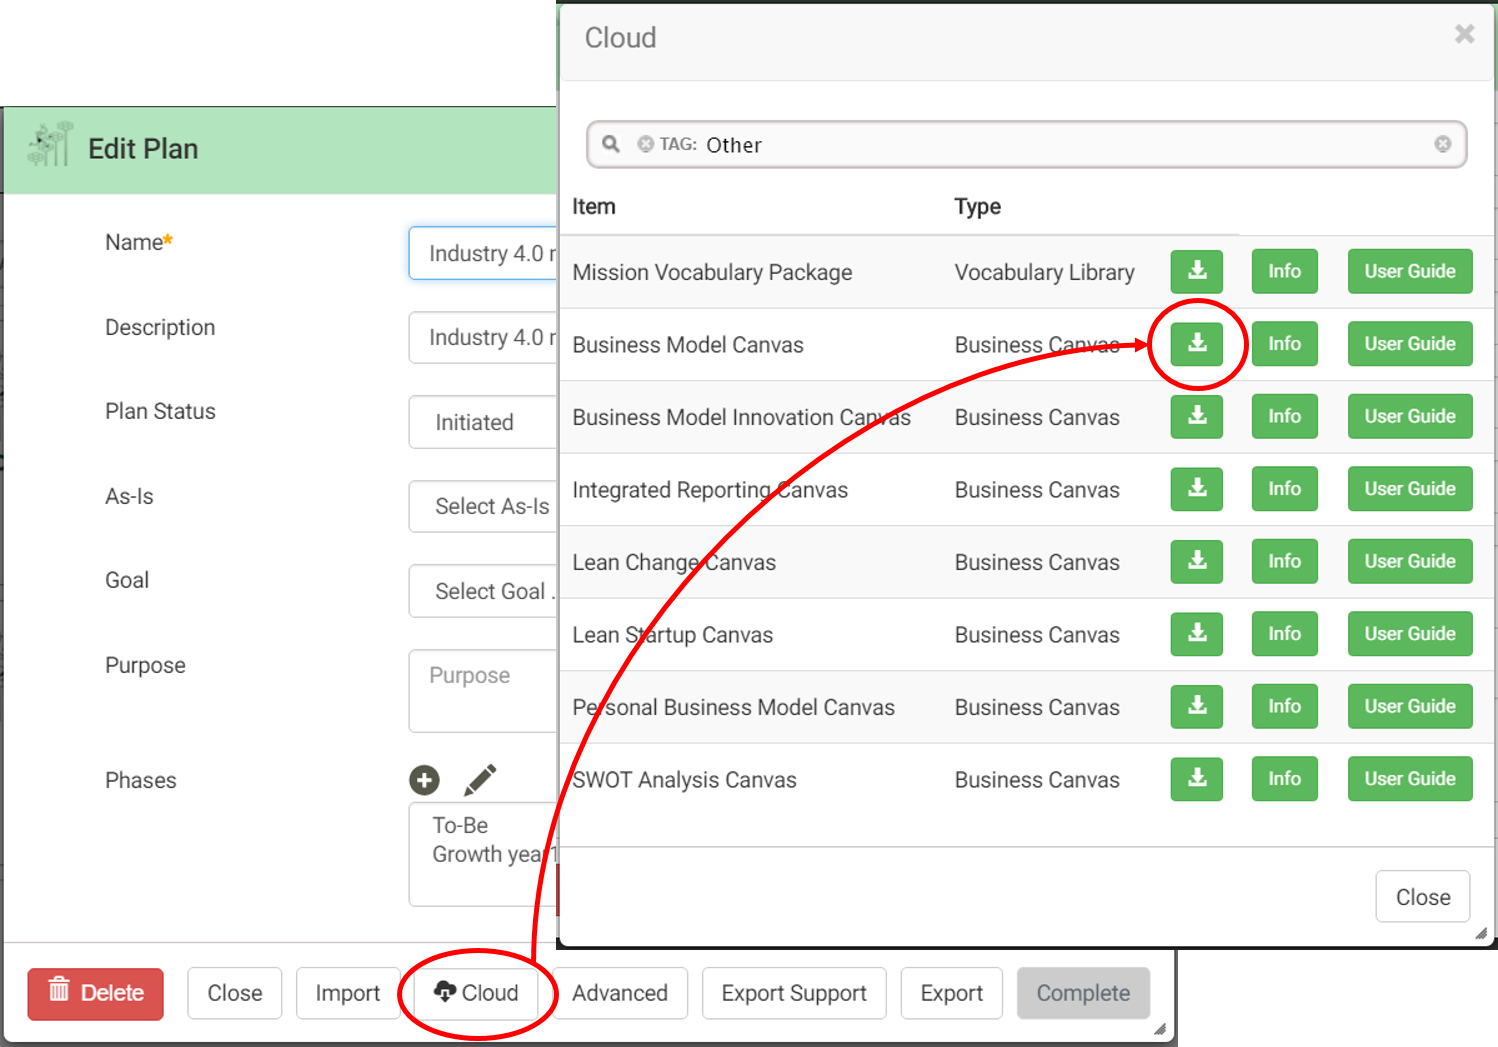
You can start now. Structure your idea into a strategy on one page and use it as a starter for Continuous Business Model Planning. Import the Business Canvas template(s) from our Cloud storage into to your Plan and you are ready to go:
After you have associated the selected canvas template(s) with your plan, you can create canvases of the selected templates with your team. But the process doesn’t stop at this stage. VDMbee Strategyplanner let you transform the content into structured Business Models and add the needed details to get ready for business simulation and scenario analysis.

