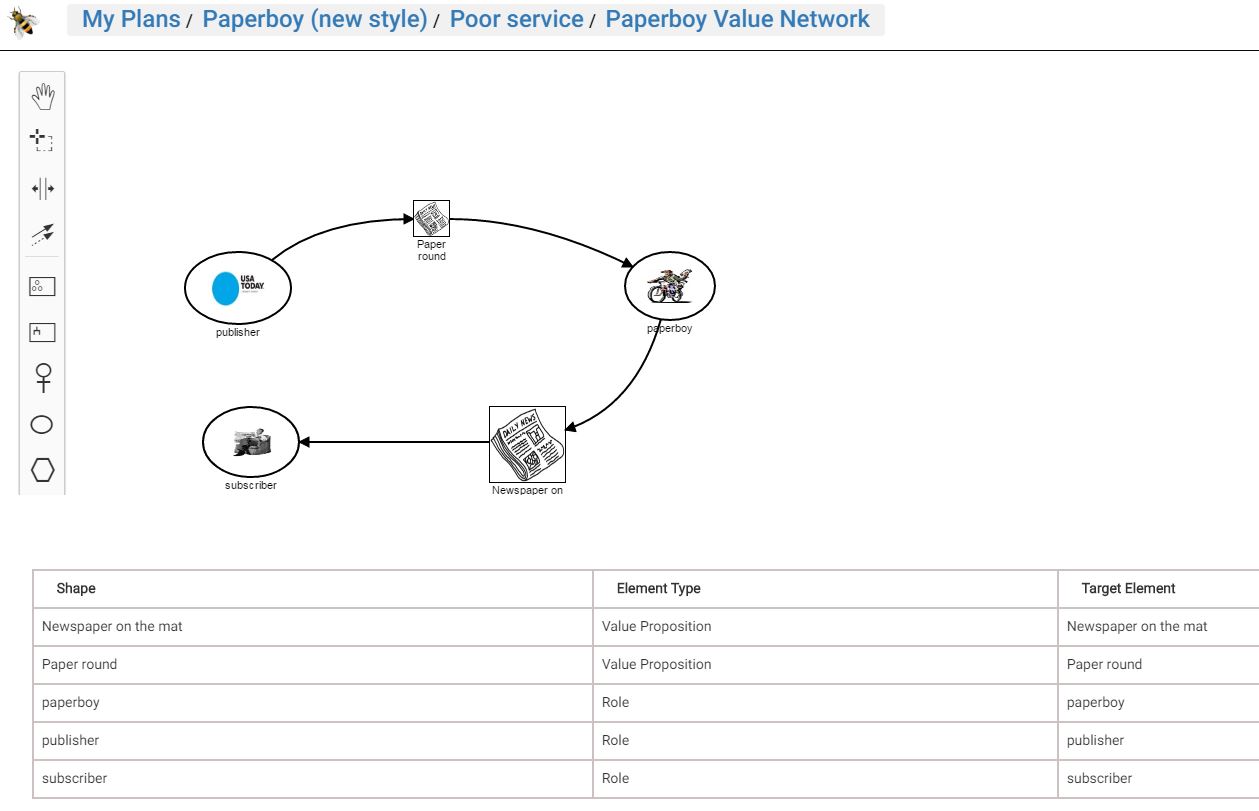
With The Business Ecosystem Map module, you design the Value Proposition exchange in your Value Network.
The Business Ecosystem Map module is part of Strategyplanner, to support the discovery effort with a graphical notation language.
The Business Ecosystem Map offers the following customer benefits:
Map your value network in a graphical notation for unambiguous interpretation with your clients, peers and principals.
Analyze your value network, in detail, with VDMbee Strategyplanner
Provide the big picture of the business ecosystem in which business models live
Oversee and understand business relationships, expressed in value proposition exchanges
Seamless and contextual interaction between value networks and business simulation
With the Business Ecosystem Map you can design your Value Network to create a detailed insight how the Value Propositions are exchanged. This can be done on high-level, such as exchanges between market segments and your business, but also at a detailed level, such as exchanges between roles internally in your organization. All details can be mapped into the underlying VDML model and are therefore available for further Value analysis

A Business Ecosystem Map can be designed to graphically specify how Participants in Business Model(s) collaborate by exchanging Value Propositions with each other. This map is typically used to provide a big picture of the Business Ecosystem in which Business Models live. It will also help to oversee and understand relationships in the often complex situations.
A Business Ecosystem Map can include various levels of detail, whereby nodes in the graph may represent Participants, their Roles or their Business Models, even in hybrid combinations. Connectors represent how Value Propositions are provided and received.
Elements in the Business Ecosystem Map can be mapped to elements in structured Business Models and their related Participant Networks and Value Propositions in Strategyplanner. Based on such mapping, elements in structured Business Models can be created and existing ones can be selected for visualization.

