Dashboards play an important role during the “Adopt” stage of an initiative. They are used to demonstrate Value impact of Plans, and their related business models, as prototyped during the “Prototype” stage of an initiative. As such they are an ideal means to support managerial decision making. Different Dashboards may be designed for different stakeholders in the decision process.
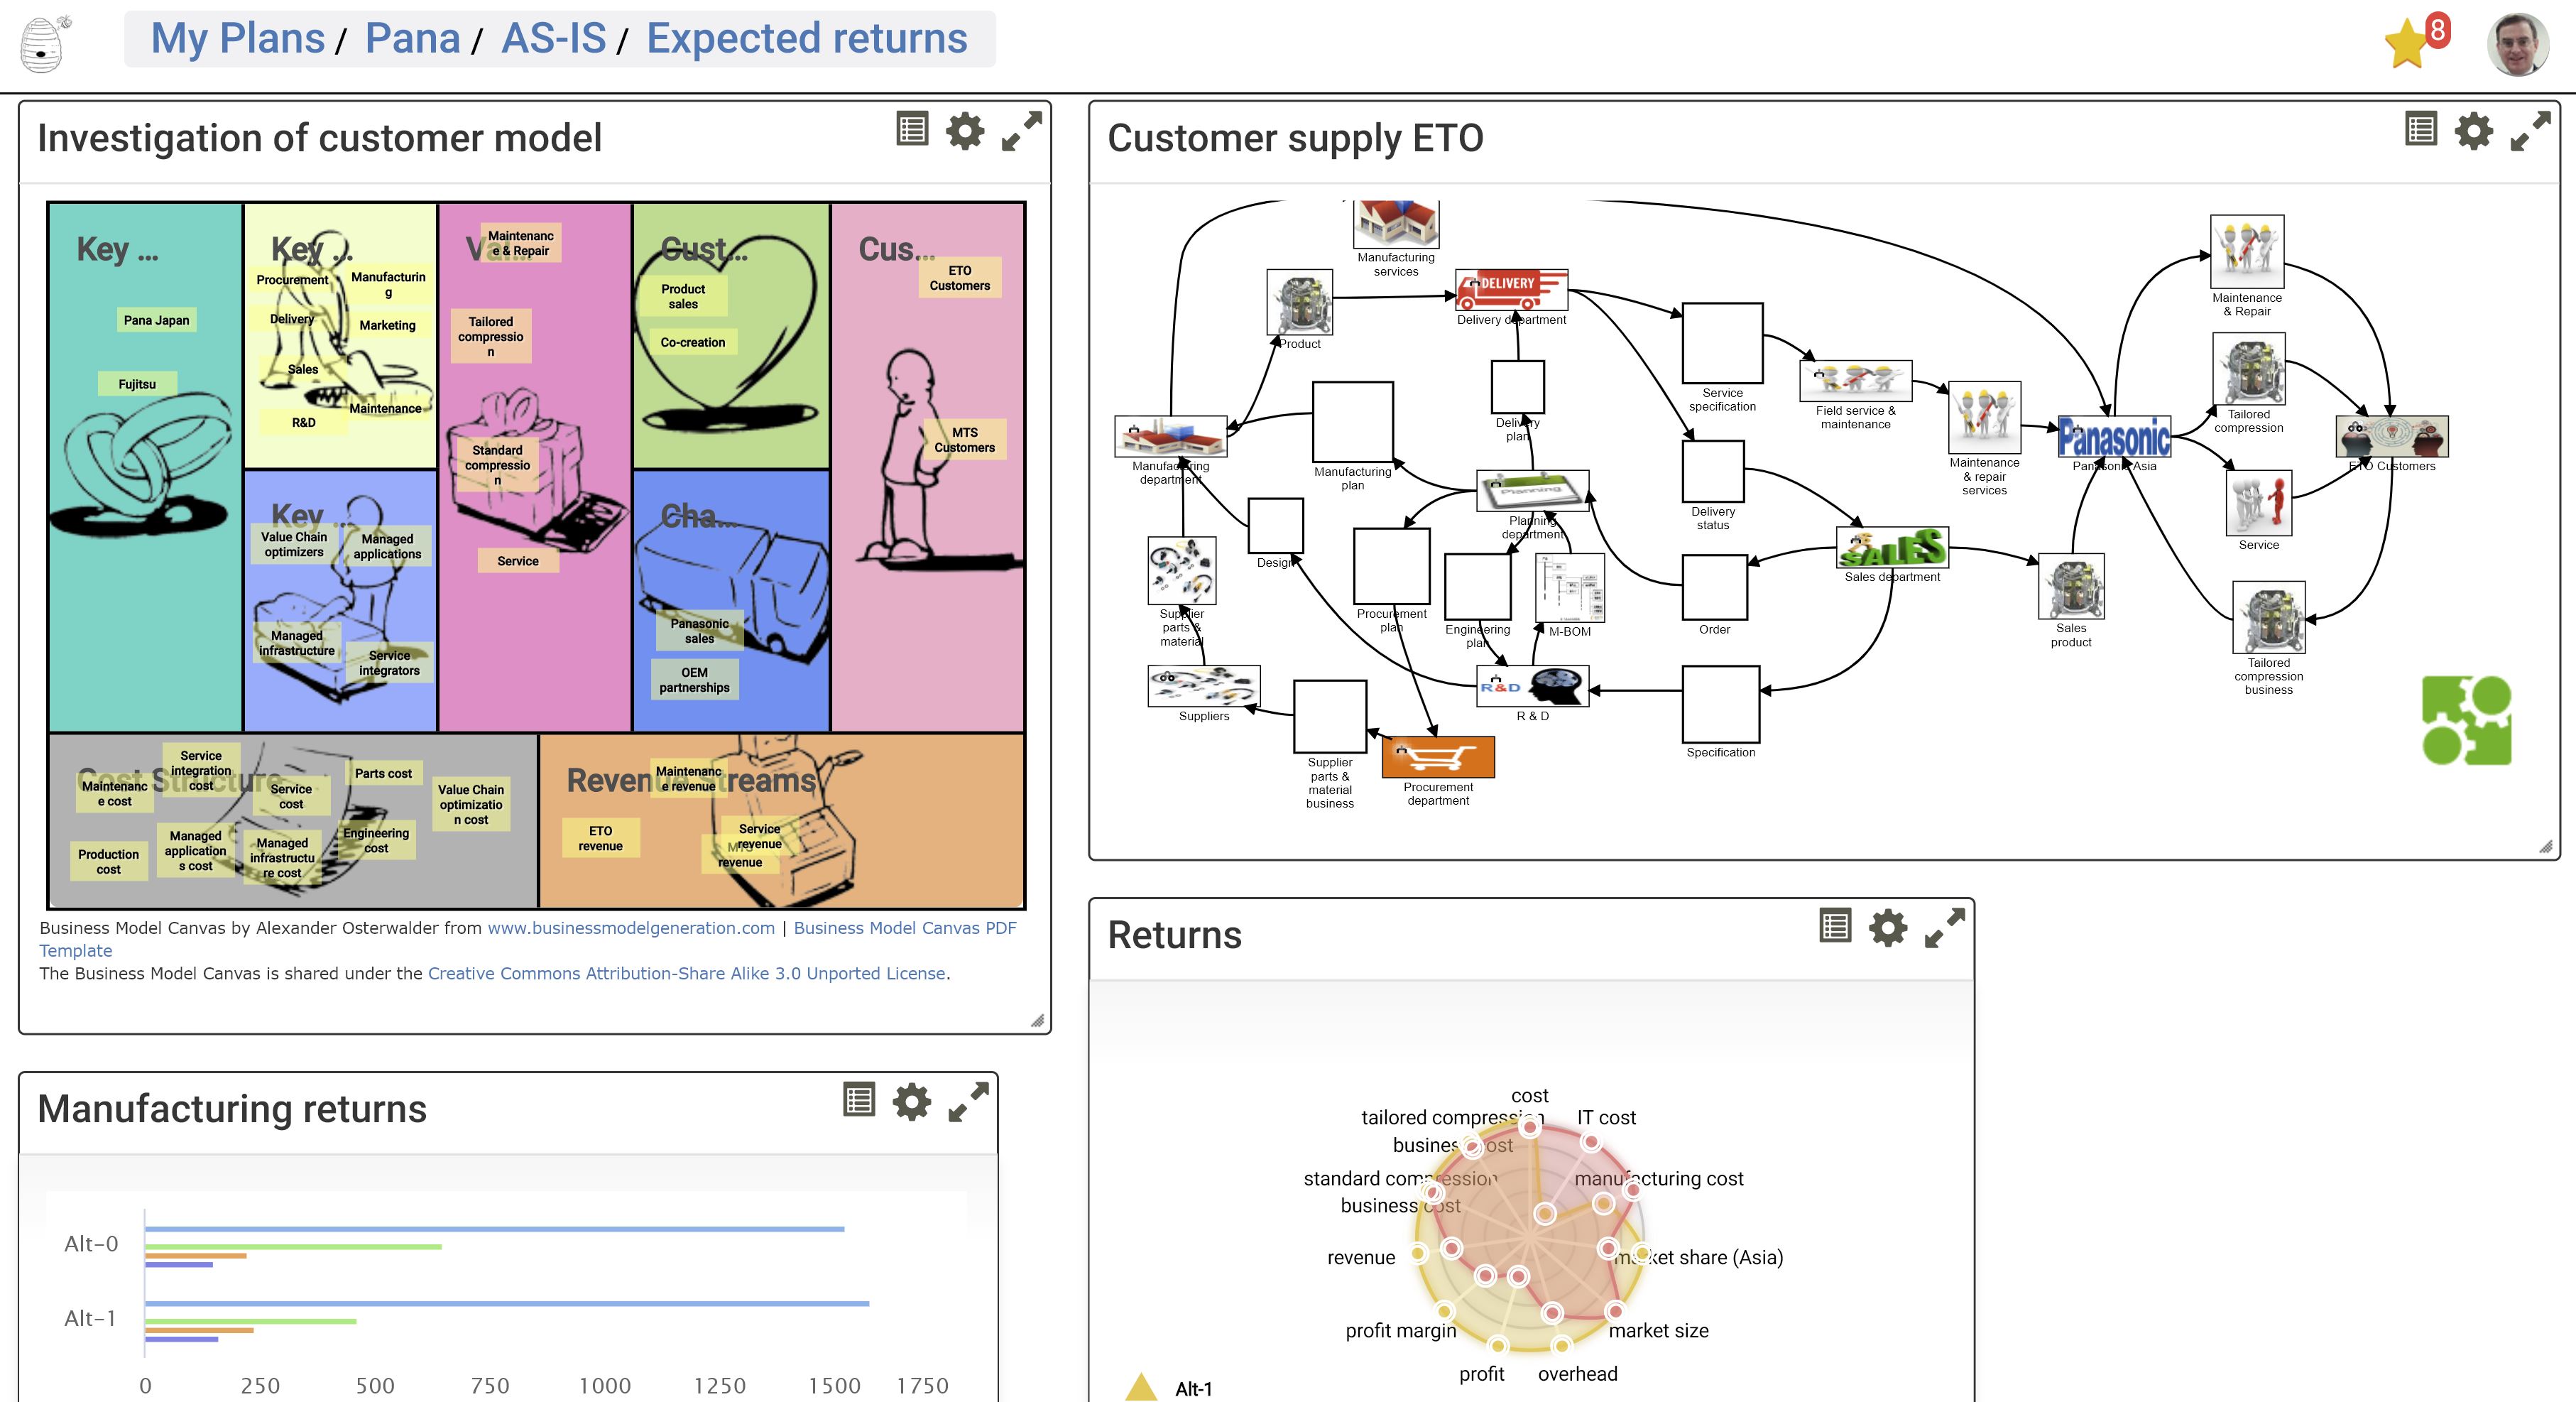


In a Dashboard, you can group multiple perspectives together to support you an your advisory practice. Artifacts like: Business Canvasses, Business Ecosystem Maps, Value Stream Maps and Capability Maps as well as Value impact measurement presentations (tables and charts of many forms) and even rich text can be used to compose your Dashboard.
Dashboards also come with light-weight what-if Scenario analysis and simulation support, whereby different Measurement sets, for a selective subset of Input Values can be used.
In addition to, interactively, showing as-prototyped Value impact, Dashboards can also include “actuals”, based on Business Model performance, monitored after implementation of the new or adapted Business Model design. This performance can be imported into the Value Management Platform, and included in Dashboards, to compare “Plan” with “actuals”. This makes CBMP a closed-loop method (“Business Model as a sensor”)
