Continuous Business Model Planning (CBMP) needs a “language” to define how the Business operates, in conjunction with Customers and Partners, both As-Is and To-Be. It is useful to do that in terms of Business Models. A Business Model (BM) defines how a Business, in a particular product-market/customer combination, creates and delivers Value for the stakeholders involved.
BMs may be Customer-facing, as well as internal. As any Activity within the Business can be considered to be part of one or more BMs, BMs can be used to decompose the mission of the Business therefore. CBMP uses Business Models as Units for Strategic Planning. In terms of modeling, the scope of a Plan is covered by one or more BMs. These BMs may evolve over time, from Phase to Phase, or may alter, from one Alternative to another within the same Phase.
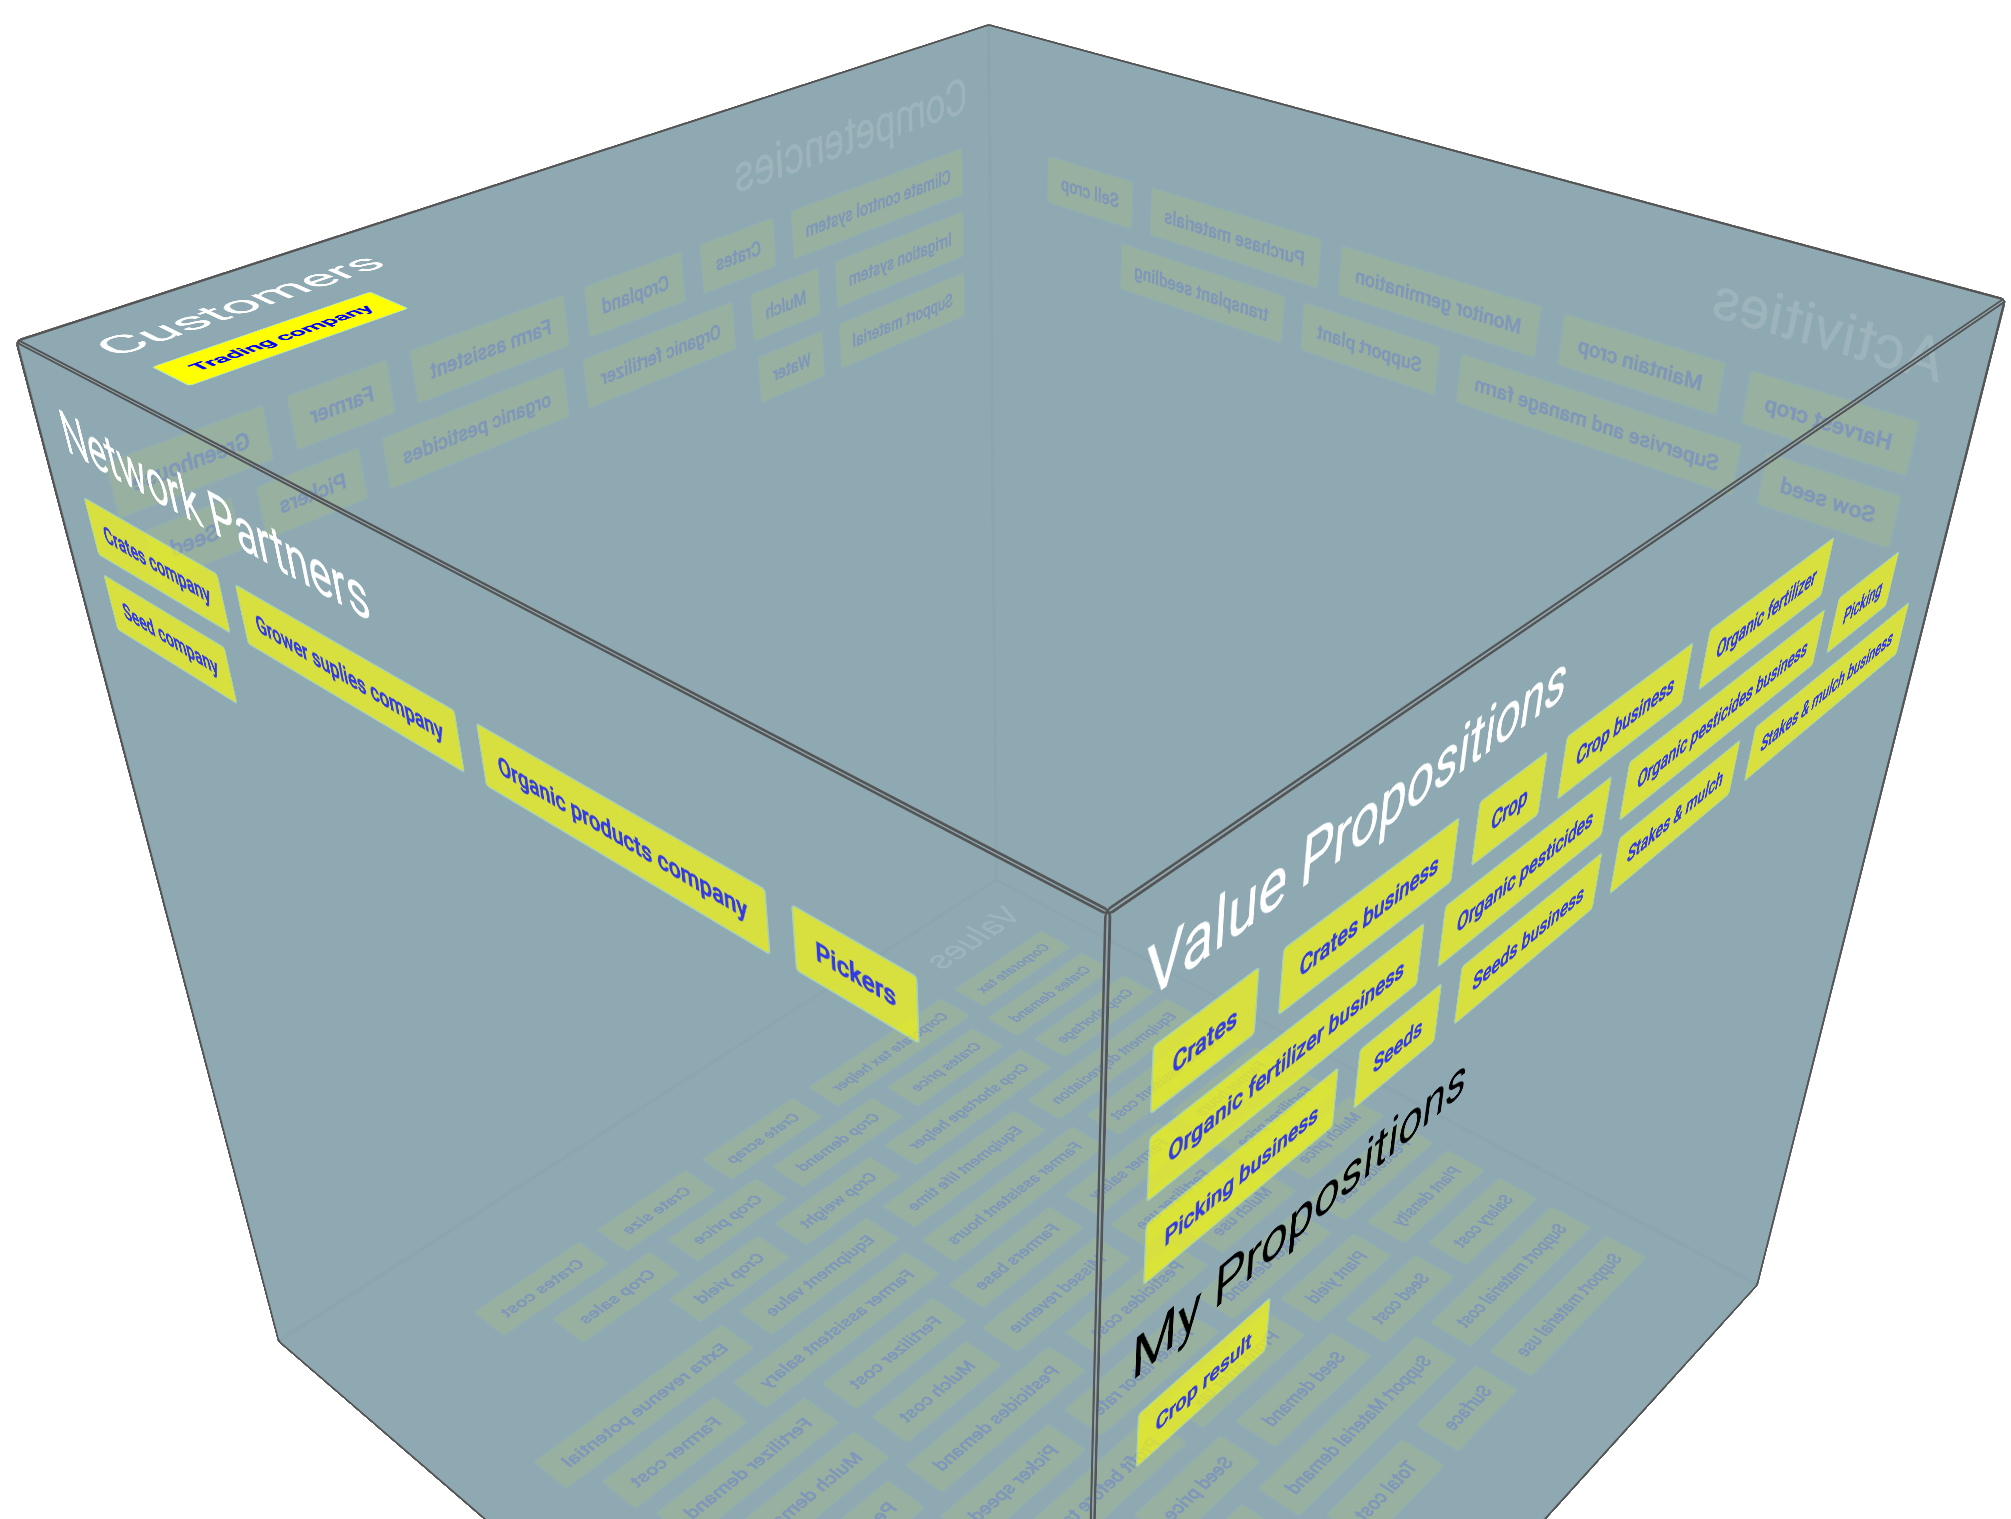
During Discovery, Business Canvases, such as the Business Model Canvas, can be used to represent BMs. For purpose of prototyping, the Value Cube, as a more “canonical” BM representation, is used. It is based on the “Business Model Cube” work of prof. Peter Lindgren of Aarhus University. The equivalent term “Business Model Cube” is used in the CBMP Training program and in Strategyplanner collateral as well.
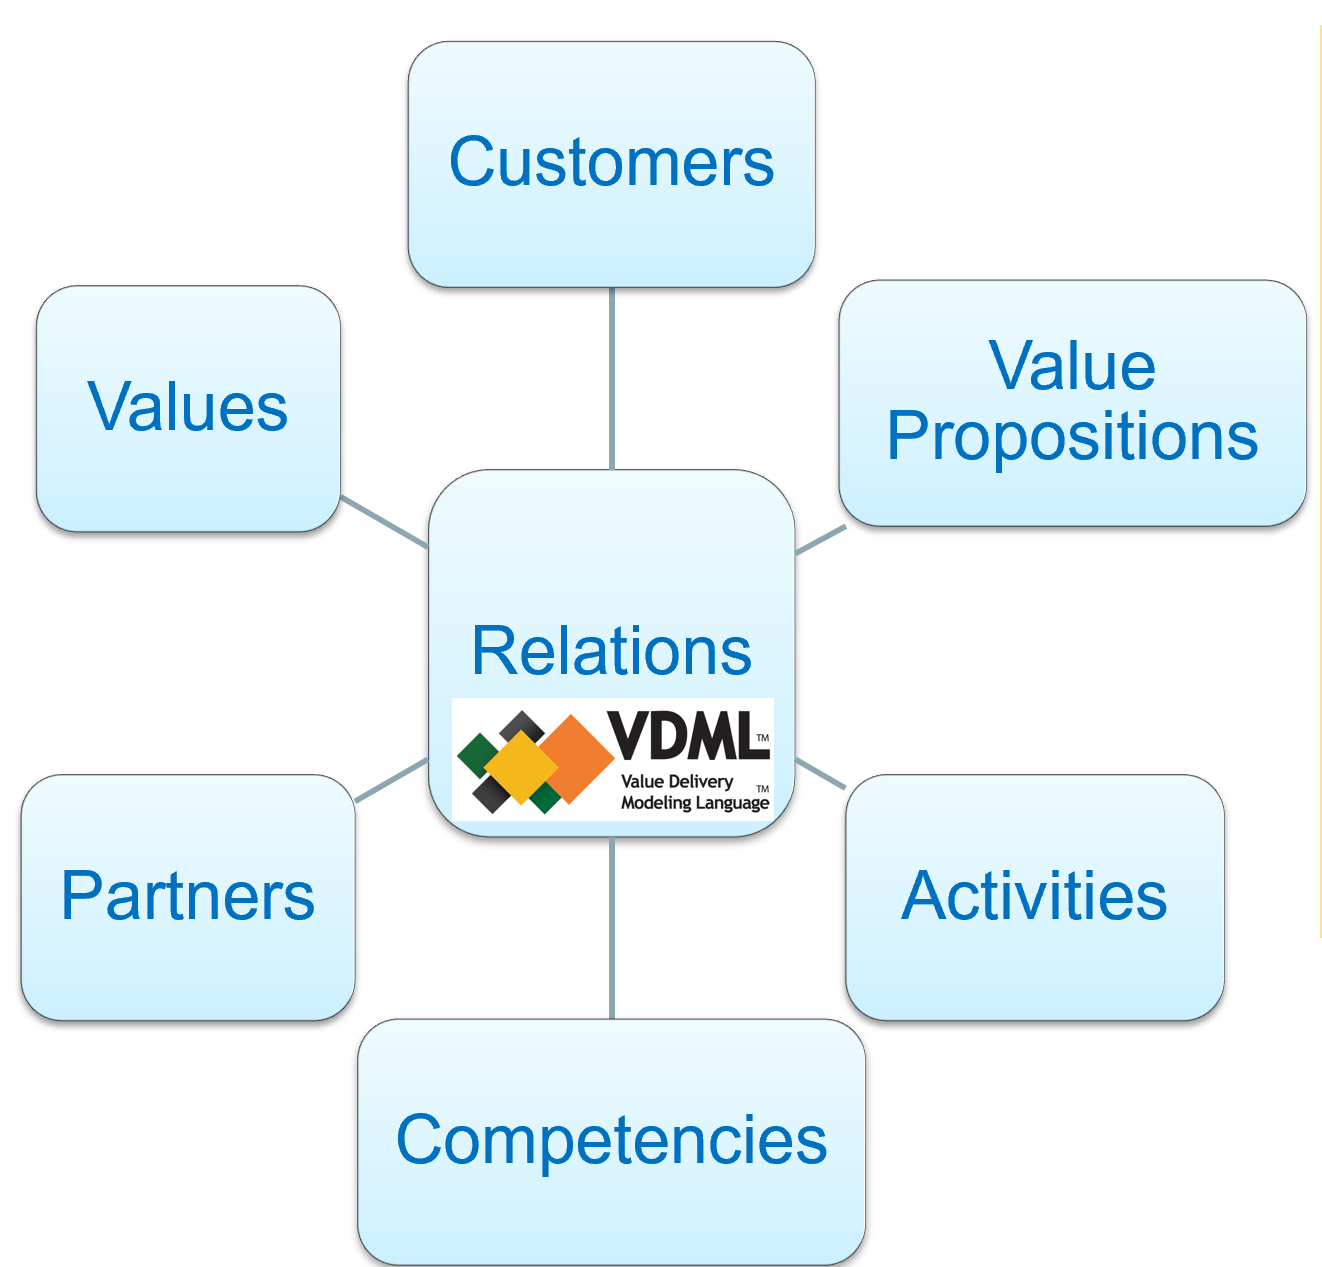
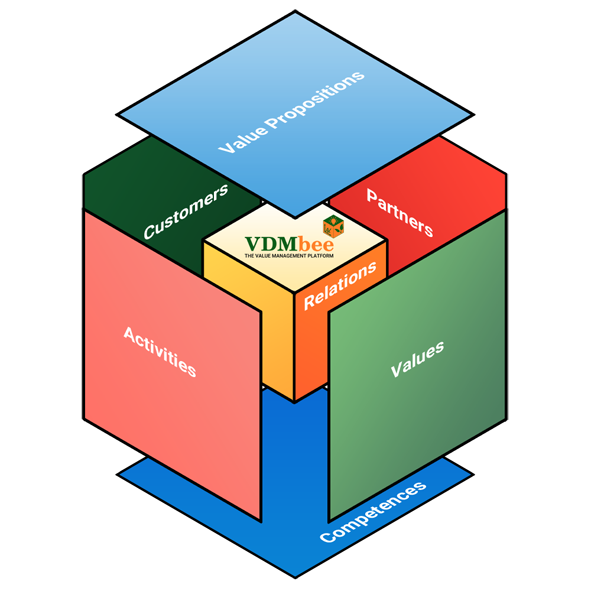
The Value Cube consists of six dimensions:
- Customers
- Value Propositions
- Activities, needed to create Value Propositions
- Competencies, as used by Activities
- Partners
- Values of Value Propositions and Activities
These six dimensions also form, literally, a “cube”.

The Value Cube concept was introduced according to the observation that a BM is not a silo, but that real-world cases are about ecosystems of collaborating BMs, from multiple perspectives (different Participants). Focus is not so much on elements of an individual BM, but on the understanding of how elements are related, both intra- and inter-BM, and work together, as a system or Value creation “machine”.

The Value Delivery Modeling Language (VDML) is adopted as metamodel, to give “hands and feet” to Value Cube concepts, and to define these relationships. Following the cube-metaphor, these relationships can be considered the “wiring” inside the box.
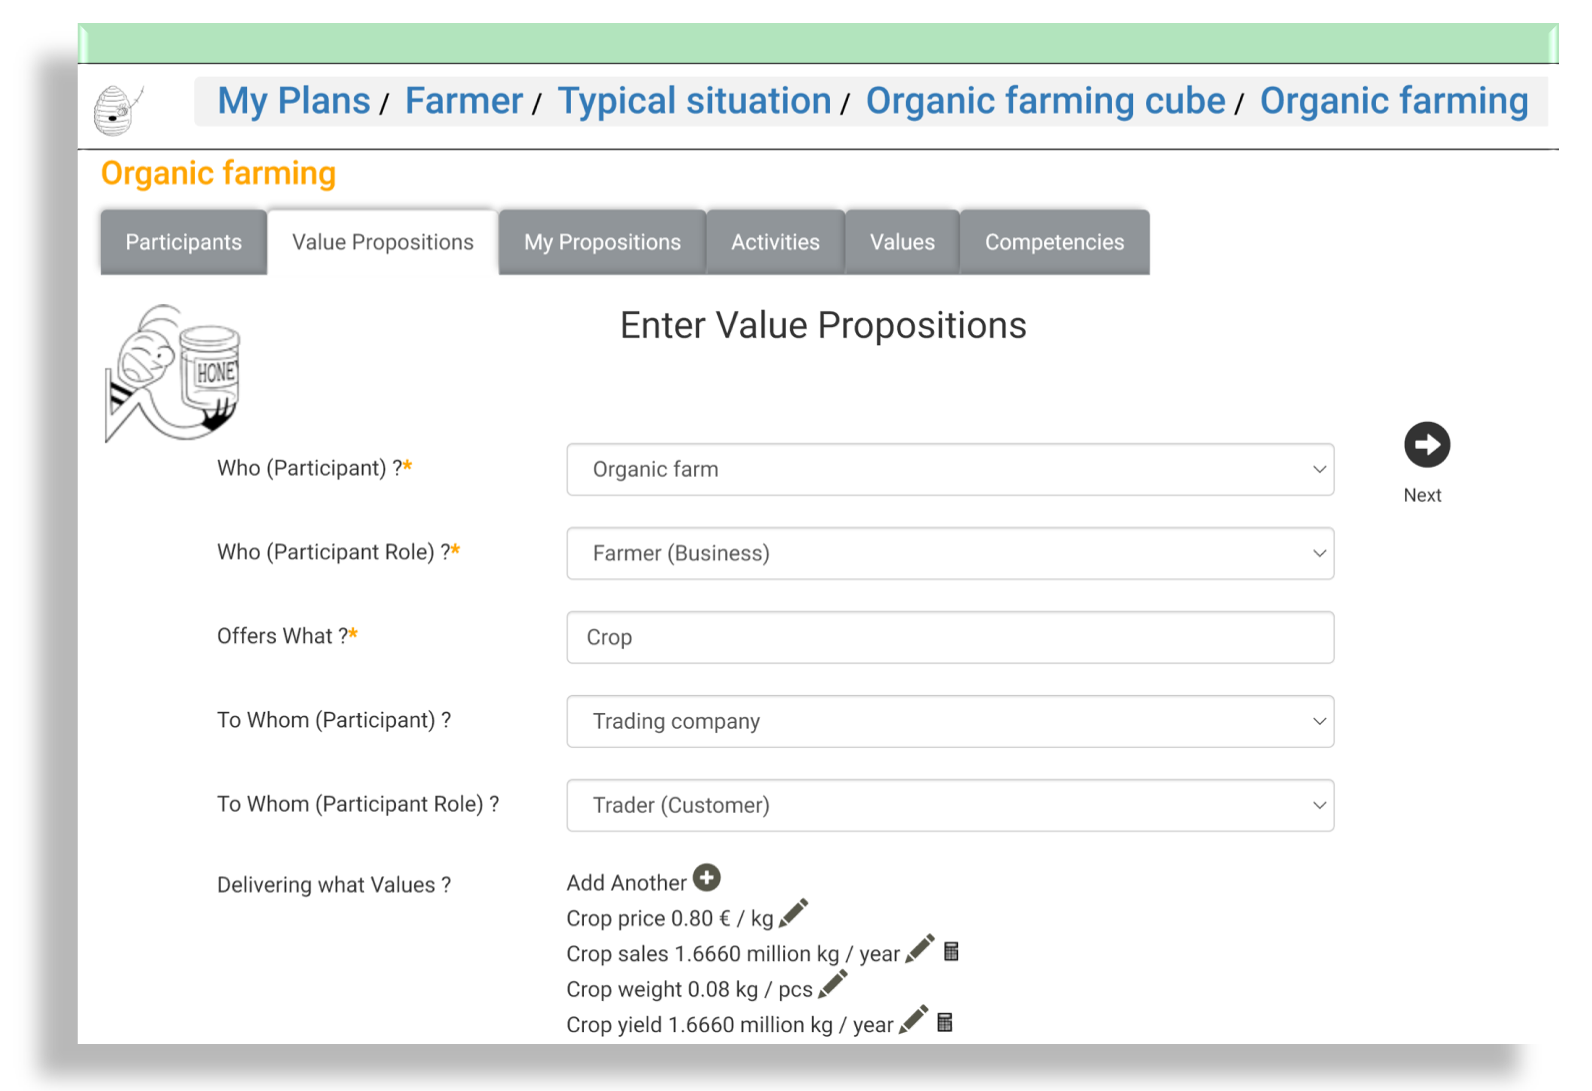
Value Cube dimensions also form the tabs in the Value Cube UI in Strategyplanner, through which the user can create the model, through a story-telling, text-oriented UI, abstracting from underlying metamodel details.


For ease of understanding, this data can, for the greater part, also be generated, via semi-interactive wizards, from the graphical Maps as created during Discovery, such as the Business Ecosystem Map, Value Stream Maps and Strategy Map. It is also possible to derive it from Business Canvases. Reversely, these Maps and Canvases can also be used to depict already created BMs. In a way, the graphical Maps and Canvases also serve as partially overlapping views of the underling integrated model, being the Value Cube models.

